Biology investigation: temperature and Daphnia heart rate
What this lesson covers
- Writing a purpose as a testable hypothesis, linked to a biological idea such as enzyme activity in an ectotherm.
- Choosing a valid range for the independent variable, measuring the dependent variable well and controlling the key variables.
- Sample size, independent repeats and the ethics of using live animals in an investigation.
- Processing data: means, standard deviation, error bars and a Q10 value.
- Judging validity and reliability, and explaining the biology behind the trend using your data and other sources.
What the standard rewards
- This is an internal standard: you plan and carry out your own investigation with your teacher's guidance, then hand in a report. You may change your method after a trial run, and you should say why you did.
- The report needs a hypothesis, a method, raw and processed data, a graph, a conclusion that answers the purpose, and findings from at least one other source.
- The step up at each grade is in how well you justify your choices and link the result to biology.
| Grade | What the report shows |
|---|---|
| Achieved | A hypothesis linked to a biological idea; a method naming the variables and range; data collected and processed; a conclusion that answers the purpose; a finding from another source. |
| Merit | A valid method that deals with sampling bias and sources of error; reliable data showing a clear trend (or none); a valid conclusion; the biology explained using both your results and another source. |
| Excellence | Choices justified by evaluating validity and reliability; a conclusion that discusses the biology and compares your findings with published work or a model. |
Purpose and hypothesis
- Daphnia (water fleas) are small freshwater crustaceans and ectotherms: their body temperature follows the water around them, so warmer water warms every cell.
- The heart's beat is driven by pacemaker cells whose ion pumps and channels, and the enzymes making ATP for the muscle, all work faster when molecules have more kinetic energy.
- A purpose written as a hypothesis names both variables, predicts the direction and gives the reason: as water temperature increases from 10 °C to 30 °C, the heart rate of Daphnia will increase, because metabolic reactions speed up with temperature.
- A null hypothesis is useful too: temperature has no effect on heart rate. Your data then either support rejecting it or do not.
Variables and a valid range
- The independent variable is what you change, the dependent variable is what you measure, and controlled variables are kept the same so they cannot explain the result.
- Pick a range that is wide enough to show a trend but safe for the organism: Daphnia live in ponds from about 5 °C to the mid 20s, so 10, 15, 20, 25 and 30 °C covers the realistic range with five evenly spaced values.
- A trial run tells you what is practical; one class found counting by eye was impossible above 250 beats per minute, so they filmed in slow motion on a phone through the eyepiece and counted from playback.
| Variable | In this investigation | How it is set or measured |
|---|---|---|
| Independent | Water temperature | Water bath at 10, 15, 20, 25 and 30 °C, checked with a thermometer |
| Dependent | Heart rate (beats per minute) | Beats counted for 15 s from slow-motion video, multiplied by 4 |
| Controlled | Acclimation time | 5 minutes at each temperature before counting |
| Controlled | Daphnia size and culture | Adults of similar length from the same culture |
| Controlled | Water and light | Same culture water; microscope lamp on for under 1 minute |
Try it: repeats and outliers
Controls, sample size and repeats
- Use a different Daphnia for each repeat, five at each temperature: counting one animal five times only shows how well you count, not how Daphnia vary.
- Assign animals to temperatures at random, by drawing them from the culture with a pipette without picking the biggest or most active.
- The microscope lamp heats the slide, so a slide reading taken after the lamp has been on for minutes is a hidden variable; switch the lamp off between counts or use an LED.
- A control is the 20 °C group, close to the culture's own temperature, which gives the normal rate the others are compared with.
Ethics of working with live animals
- The Animal Welfare Act 1999 covers vertebrates and some invertebrates such as crabs, crayfish and octopus; Daphnia are not covered, but the same principles of care apply.
- Use the fewest animals that give reliable data, keep each one out of its culture water for the shortest time, and do not go above 30 °C, where Daphnia show heat stress.
- Return each animal to a recovery container at room temperature, and never test drugs such as caffeine or alcohol on them without your teacher's approval.
- Say in your report what you did to look after the animals; it is part of a valid method.
Example: processing the class's results
- A Year 13 class counted the heart rate of five Daphnia at each temperature.
- Find the mean and standard deviation for the 20 °C group.
| Temperature (°C) | Daphnia 1 | 2 | 3 | 4 | 5 | Mean | Standard deviation |
|---|---|---|---|---|---|---|---|
| 10 | 148 | 155 | 142 | 160 | 150 | 151 | 6.9 |
| 15 | 196 | 210 | 188 | 205 | 201 | 200 | 8.5 |
| 20 | 248 | 262 | 240 | 255 | 250 | 251 | 8.2 |
| 25 | 294 | 312 | 288 | 305 | 301 | 300 | 9.4 |
| 30 | 318 | 340 | 305 | 336 | 326 | 325 | 14.1 |
- mean = (248 + 262 + 240 + 255 + 250) ÷ 5 = 1255 ÷ 5 = 251 beats per minute
- differences from the mean: −3, 11, −11, 4, −1each value minus 251
- squares: 9 + 121 + 121 + 16 + 1 = 268
- variance = 268 ÷ (5 − 1) = 67divide by n − 1 for a sample
- standard deviation = √67 = 8.2 beats per minute
- 8.2 is small next to 251, so the five Daphnia agree closely
Example: the graph and the Q10
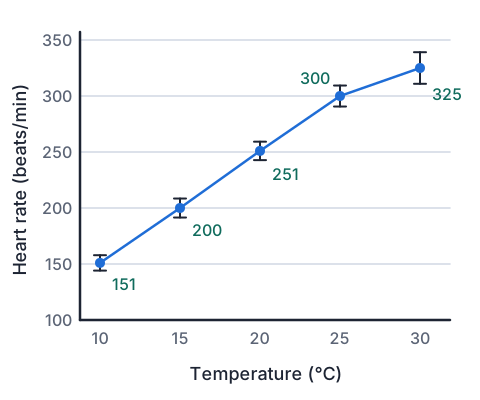
- Plot the mean at each temperature with error bars of one standard deviation above and below, and join the means with a line or a smooth curve, not a ruler line through the origin.
- The rise is steady from 10 to 25 °C, then smaller from 25 to 30 °C, where the error bar is also widest.
- Q10 compares the rate at one temperature with the rate 10 °C higher; most enzyme-controlled processes have a Q10 of about 2.
- Q10 = rate at (T + 10) ÷ rate at T
- 10 °C to 20 °C: Q10 = 251 ÷ 151 = 1.7
- 20 °C to 30 °C: Q10 = 325 ÷ 251 = 1.3
- Q10 falls at higher temperatures, so the rate is levelling off
Try it: the class's mean heart rates
Statistics: what error bars tell you
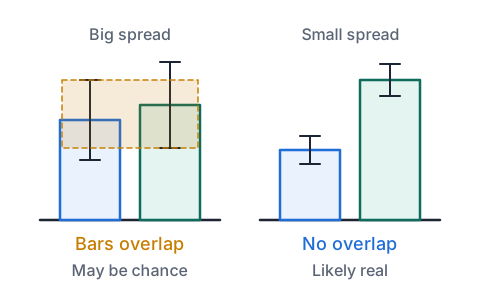
- Standard deviation measures the spread of the repeats; a large one means the individuals vary a lot or the measurement was hard to make.
- If the error bars of two groups overlap a lot, the difference between their means could easily be chance; if they do not overlap, the difference is probably real.
- A t-test makes that judgement with a number: for 25 °C against 30 °C, t is about 3.3, larger than the critical value of about 2.4 for this sample size, so the difference is unlikely to be chance.
- Five Daphnia per group is the bare minimum; ten would narrow the spread of the mean and make a small difference easier to detect.
Validity and reliability
- Validity asks whether you measured what you meant to: did the Daphnia's body actually reach the water temperature, and did the lamp warm the slide during counting?
- Reliability asks whether you would get the same result again: small standard deviations and agreement with other groups or published data show reliable data.
- Sources of error are specific: miscounting fast beats, the slide cooling or warming while you count, and animals of different ages or sizes.
- For Excellence, say how each choice in your method reduced one of these, and how much that error could have changed your conclusion.
The biology behind the trend
- Between 10 and 25 °C, extra kinetic energy means more successful collisions between enzymes and substrates, so respiration supplies ATP faster and the pacemaker cells reach their firing threshold sooner.
- Above about 25 °C the rise slows: some enzymes are near their optimum and the heart muscle cannot shorten and relax much faster, so the Q10 drops.
- The wider spread at 30 °C fits heat stress: some individuals cope better than others, which is why the investigation stopped there.
- Published work on Daphnia and other ectotherms shows the same shape, which lets you compare your Q10 with theirs and discuss why yours differs.
Example: the conclusion at three grades
- Each answer below is about the same data; notice what is added at each step.
| Grade | What the student wrote |
|---|---|
| Achieved | As temperature increased from 10 °C to 30 °C the mean heart rate increased from 151 to 325 beats per minute, so my hypothesis was supported. |
| Merit | Heart rate rose steadily to 300 beats per minute at 25 °C. Daphnia are ectotherms, so warmer water speeds up the enzymes of respiration and the pacemaker cells fire sooner. The small standard deviations (under 10) and non-overlapping error bars show a reliable trend. |
| Excellence | The Q10 fell from 1.7 between 10 and 20 °C to 1.3 between 20 and 30 °C, so the heart rate is levelling off as enzymes near their optimum, matching published Daphnia studies. The 30 °C group had the largest spread (14.1), which fits heat stress varying between individuals. Because I used five different animals at each temperature and controlled lamp heating, I am confident the trend is real, but ten animals per group would make the 25 to 30 °C difference more certain. |
Common mistakes
- I counted the same Daphnia five times, so I have five repeats.Those are repeat readings of one animal; independent repeats need five different Daphnia, so the result applies to Daphnia in general.
- The error bars overlap, so temperature had no effect.Overlap means the difference between those two groups is uncertain, not that there is no effect; look at the whole trend and test it.
- Higher temperature denatures the enzymes, so heart rate falls at 25 °C.The data show heart rate still rising at 25 °C; describe what the data show before reaching for an explanation.
- My results prove the hypothesis.Results support or do not support a hypothesis; a small sample from one culture cannot prove it.
Does a short climb change your heart rate?
You need: a phone with a stopwatch, a staircase or a low step, paper and a pen, two or three family members, if they will help
- Sit still for 3 minutes, then find your pulse at the wrist and count it for 15 seconds; multiply by 4 for beats per minute.
- Step up and down a low step for 1 minute at a steady pace, then count your pulse straight away for 15 seconds.
- Rest for 5 minutes and repeat both readings twice more, so you have three repeats of each.
- If family members join in, record each person's results separately; these are independent repeats, unlike your own three.
- Work out each mean and the range. Look for: a clear rise after exercise, and more spread between people than between your own repeats.
Safety: Use a low step and hold the rail; anyone with a heart or breathing condition should only do the resting count.
Your turn
A Daphnia's heart beats 58 times in 15 s. What is its heart rate in beats per minute?
Five Daphnia at 15 °C gave 210, 224, 198, 215 and 203 beats per minute. Find the mean.
Using the class's means, calculate Q10 between 15 °C and 25 °C.
Why did the class leave each Daphnia at the test temperature for 5 minutes before counting?
Why is counting five different Daphnia better than counting one Daphnia five times?
Show answer
1. 58 × 4 = 232 beats per minute. 2. (210 + 224 + 198 + 215 + 203) ÷ 5 = 1050 ÷ 5 = 210 beats per minute. 3. Q10 = 300 ÷ 200 = 1.5. 4. So the Daphnia's body, an ectotherm, reached the water temperature before the heart rate was measured; otherwise it would still reflect the culture temperature. 5. Different animals vary, so five individuals show whether the effect holds for Daphnia in general; one animal counted five times only tests the counting.
Your turn: evaluate
The 30 °C group had the largest standard deviation. Give a biological reason.
Name one source of error that would make every reading too high, and how to reduce it.
Another class found Q10 = 2.1 between 10 and 20 °C. Give one reason the two classes could differ.
Show answer
1. At 30 °C Daphnia are near their upper limit, so heat stress affects individuals differently; some keep up a fast rate while others slow. 2. The microscope lamp warming the slide during counting raises the real temperature above the set value, so the heart beats faster; switch the lamp off between counts or use a cool LED light. 3. Their Daphnia may have been a different age, size or culture, or kept at a different temperature before the test, which changes their metabolic rate.
Recap
- Write the purpose as a hypothesis that names both variables, predicts the direction and gives a biological reason.
- Use a valid range, control the variables that matter, and use different individuals as repeats, treating animals with care.
- Process with means and standard deviations, graph with error bars, and use Q10 or a t-test to judge the trend.
- Excellence justifies each choice by its effect on validity and reliability and compares the result with published biology.
| Step | In the Daphnia investigation |
|---|---|
| Hypothesis | Heart rate rises with temperature from 10 to 30 °C |
| Method | Five Daphnia at each of five temperatures, 5 minutes acclimation |
| Processing | Means, standard deviations, error bars, Q10 |
| Conclusion | Rate rose from 151 to 325 beats per minute, levelling off above 25 °C |
The maths behind it
Report a mistake
How is NCEA Level 3 maths going?
See the NCEA Level 3 maths guide