Science language, graphs and judging a claim
What this lesson covers
- Science language is the technical words of science; used correctly it makes a claim clearer and more credible, and misused it can make a weak claim sound expert.
- Science conventions are the agreed ways scientists show evidence: units, labelled graphs, sample size, control groups, repeats, peer review, references and dates.
- A graph can mislead through a cut-off axis, missing units or a hand-picked time range.
- A correlation (two things changing together) does not show that one causes the other.
- Merit answers explain how each convention makes a claim more or less believable; Excellence answers weigh several together and say what would make the claim stronger.
Science language: precise words, or just sounding clever?
- Science language means technical terms with exact meanings: biodegradable, placebo, statistically significant, UVB, bacteria, pH.
- Used correctly, and explained for the reader, these words make a claim clearer and show the writer understands the topic.
- Used loosely, they borrow the look of science: "chemical-free" (everything is made of chemicals), "detox", "boosts immunity", "clinically proven" with no trial named.
- Cautious words such as "may", "suggests" and "in this sample" are honest about uncertainty, while "proves" and "guaranteed" claim more than any single study can show.
- In the exam, do not just list science words: pick two or three and say what effect they have on how believable the claim is.
Science conventions and what each one tells you
- Conventions are the agreed habits scientists use so that others can check their work.
- Each one is a question you can ask of a resource: is it there, is it done properly, and what does that mean for the claim?
- A missing convention matters as much as a present one: a graph with no units, or a study with no date, gives you less reason to trust it.
| Convention | Ask | Why it matters |
|---|---|---|
| Units | Are quantities given in mL, kg, %? | Without units a number cannot be checked or compared |
| Graph labels and scale | Labelled axes? Does the axis start at 0? | A cut-off axis can exaggerate a difference |
| Sample size | How many people or tests? | Small samples can give a fluke result |
| Control group | Was it compared with no treatment or a placebo? | Without one you cannot tell what caused the change |
| Repeats | Was it done more than once, or by other teams? | Repeated results are more reliable |
| Peer review | Was it checked by independent experts? | Errors and bias are more likely to be caught |
| References and date | Are sources listed? Is it recent? | Lets you check it; old evidence may be out of date |
Example: one set of results, two graphs
- Room 11 tested two brands of paper towel, three sheets each, and found the mean water soaked up was 52 mL for brand A and 48 mL for brand B.
- Brand A's advert draws the bar graph with the axis starting at 46 mL.
- How much better does A look on that graph, and how much better is it really?
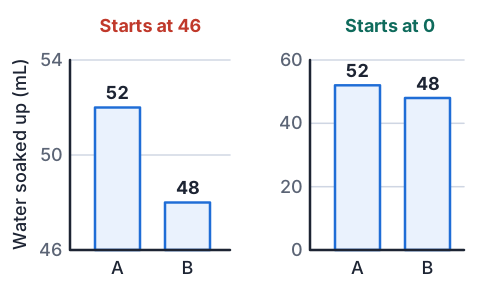
- bar A height = 52 − 46 = 6, bar B height = 48 − 46 = 2bars only show the part above 46
- 6 ÷ 2 = 3, so bar A looks 3 times as bigwhat the eye sees
- real difference = 52 − 48 = 4 mLuse the actual values
- 4 ÷ 48 × 100 ≈ 8%as a percentage of brand B
- A soaks up about 8% more, not 3 times as much; the cut-off axis exaggerates it
Sample size, controls and fair tests
- A small sample can give a result by chance: five people feeling better after a remedy could easily happen anyway.
- A large sample makes a fluke less likely, which is one reason New Zealand's Dunedin Study, following the same 1037 people for about 50 years, is so widely trusted.
- A control group gets no treatment, or a placebo (a fake pill that looks the same), so you can tell whether the treatment made the difference.
- In a blind trial people do not know which group they are in, so their expectations cannot affect the result.
- Who is in the sample matters too: 40 students from one school cannot speak for every teenager in Aotearoa.
| Study | Sample | Followed for |
|---|---|---|
| Dunedin Multidisciplinary Health and Development Study | 1037 study members | about 50 years |
Correlation is not cause
- A correlation means two things change together: when one goes up, the other tends to go up (or down).
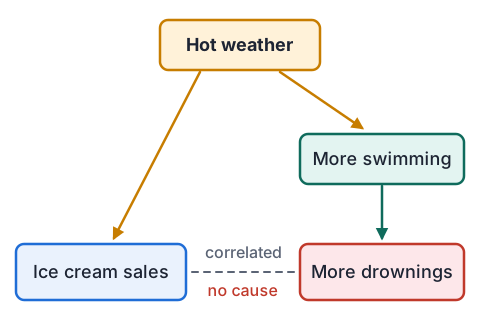
- It does not show that one causes the other. Ice cream sales and drownings both rise in summer, but ice cream does not make people drown.
- Often a third factor drives both: here hot weather means more ice creams and more swimming.
- The link can also run the other way, or be pure chance when lots of things are compared.
- To show cause, scientists change one thing on purpose, keep everything else the same and use a control group; surveys that only observe can show a link but not a cause.
Example: "Breakfast boosts NCEA results"
- A headline says "Students who eat breakfast get better NCEA results", from a survey of 2000 students that found breakfast eaters scored higher on average.
- Explain whether the survey shows that breakfast causes better results.
- the survey found a correlation: breakfast eaters scored higherwhat the evidence actually shows
- a third factor could cause both, such as a settled home routine or enough sleepother explanations
- the survey only observed students; nobody was given breakfast as a testno control group
- the large sample makes the link real, but not the cause
- it shows a link, not a cause; a trial giving one group breakfast and comparing it with a similar group would test cause
Judging a claim for Excellence
- Achieved answers name the language and conventions; Merit answers explain how each one makes the claim more or less believable.
- Excellence answers judge the whole claim: they weigh strengths against weaknesses, link conventions together and say how the evidence could be improved.
- Link, do not list: "the sample is small, and because the study was not peer reviewed nobody has checked whether that sample was chosen fairly" connects two conventions.
- Look at the resource's conventions, not the product: markers reward judging how the evidence is presented, not whether you personally believe the product works.
- Finish with a clear judgement (strongly, partly or weakly supported) and one specific change that would make the claim stronger.
| Grade | Sample sentence about a graph |
|---|---|
| Achieved | The graph has labelled axes but its axis does not start at zero. |
| Merit | Because the axis starts at 46, the difference looks much bigger than it is, which makes the claim seem stronger than the data shows. |
| Excellence | The labelled axes make the graph look scientific, but the cut-off axis and the small sample of three sheets together overstate an 8% difference; a graph from 0 with more repeats would let readers judge it fairly. |
Common mistakes
- The resource uses words like germinate and polymer, so the claim is supported.Name the words, then say whether they are used correctly and explained, and how that changes how believable the claim is.
- The graph matches the claim, so the claim is true.Judge how the graph is drawn (axis start, units, labels, sample) and why it was included, not just whether it agrees with the claim.
- Ice cream sales and drownings rise together, so ice cream causes drowning.A correlation shows a link, not a cause; a third factor such as hot weather can drive both.
- There is no peer review, so the claim is wrong.Missing peer review means nobody independent has checked it, which makes the claim less certain, not false.
Does toast land face down? Test the claim
You need: a slice of bread, a felt pen, a chopping board or tray, a table, paper and a pen
- Mark one side of the slice with a cross in felt pen: that is the "buttered" side.
- Put the board on the floor beside the table, rest the bread cross side up on the table edge and nudge it off the same way each time.
- Record which side lands down for the first 5 drops, then keep going to 30 drops.
- Work out the percentage face down after 5 drops and after 30 drops.
- Look for: how much the percentage after 5 drops differs from the one after 30, and why a claim based on 5 drops is less trustworthy than one based on 30.
Safety: Bread dropped on the floor picks up dirt and germs, so drop it onto a clean board and do not eat it afterwards.
Your turn: graphs, samples and cause
A graph's axis starts at 20. Brand X scored 30 and brand Y scored 25. How many times taller does X's bar look, and what is the real percentage difference compared with Y?
Towns with more libraries have more crime. Give the most likely reason.
50 people took a cold remedy and most felt better within 5 days. What convention is missing?
Which is more honest about a single study: "proves" or "suggests"? Why?
Show answer
1. Bar heights are 30 − 20 = 10 and 25 − 20 = 5, so X looks 2 times as tall; the real difference is 5 ÷ 25 × 100 = 20% more. 2. A third factor: bigger towns have more people, so more libraries and more crime; libraries do not cause crime. 3. A control group taking a placebo, since most colds get better in about that time anyway. 4. "Suggests", because one study can support a conclusion but cannot prove it; new evidence could change it.
Exam-style question: phones and sleep
- Resource: SleepRight NZ, which sells blue-light-blocking glasses, posts "Late-night phone use wrecks teen sleep and grades! Blue light suppresses melatonin, disrupting the circadian rhythm." A bar graph shows phone users after 10 pm sleep 7.0 and others 8.0, with the axis starting at 6.5 and no units. A footnote says 40 students at one Auckland school filled in an online survey; it was not peer reviewed.
(a) Who published this information, and why?
(b) State one science-related claim in the post.
(c) Identify the science language used.
(d) Identify the science conventions used, or missing.
(e) How well do the language and conventions support the claim? Use evidence from the resource.
Show answer
1. SleepRight NZ, a company selling blue-light glasses; to persuade teenagers or parents to buy them, while seeming to inform (Achieved). 2. Using a phone late at night makes teenagers sleep less (or lowers their grades) (Achieved). 3. Melatonin, circadian rhythm, blue light, suppresses (Achieved). 4. A bar graph with a cut-off axis and no units, a sample of 40 from one school, a survey with no control group, no peer review, and a conflict of interest (Achieved). 5. Merit: the words melatonin and circadian rhythm make the post sound expert, but they are not explained or linked to any measurement in the study, so they add authority without evidence. The axis starting at 6.5 makes a 1 hour difference look like a threefold gap, and with no units we cannot even be sure it is hours. Excellence: these weaknesses add up. 40 students from one school is a small, narrow sample, and because it is a survey it only shows a correlation; teens who stay up on phones may differ in other ways, such as stress or homework. SleepRight profits from the claim and the work was not peer reviewed, so nobody independent checked it. Nothing in the resource measures grades at all. The claim is weakly supported; a peer-reviewed study of many schools, with a group randomly asked to stop phone use at 10 pm and a graph from 0 with units, would make it far stronger.
Recap
- Science language makes a claim clearer when it is correct and explained, and only sounds clever when it is not.
- Check the conventions: units, labelled axes from 0, sample size, control group, repeats, peer review, references and date.
- A cut-off axis can make a small difference look huge; work out the real difference from the numbers.
- Correlation is not cause: look for a third factor and ask whether anything was changed on purpose with a control.
- For Excellence, weigh the strengths and weaknesses together, give a judgement and say what would make the claim stronger.
| Grade | What the marker sees |
|---|---|
| Achieved | Claim, source, purpose and specific language or conventions named |
| Merit | How each one makes the claim more or less believable |
| Excellence | Several weighed and linked, a judgement, and an improvement |
The maths behind it
How is NCEA Level 1 maths going?
See the NCEA Level 1 maths guide